Supply Chain Innovation: Three Steps Up to a Market-Driven Forecast
Last week we delved into demand and demand analytics, which has become a new supply chain innovation priority. This week we take the next step to plot specific steps to becoming more demand-driven and even to market-driven demand forecasting.
Business complexity is growing. Marketing and sales departments are investing in modern data infrastructures to unlock valuable clues to customer sentiment and behavior. But most supply chains are still using aggregated sales history and cumbersome algorithms.
In other words, most forecasting systems are surrounded by a sea of data, with no way to take advantage of it. “My kingdom for a horse!” King Richard III calls out in battle, in Shakespeare’s play. Many executives would make the same plea for good forecasting.
This inability to integrate, analyze, and leverage data is causing forecast accuracy to deteriorate. We see companies with Item-Location forecast accuracy [measured by MAPE or Mean Absolute Percent Error] of 70 percent or less. In one example, Lora Cecere of Supply Chain Insights found that due in part to weak forecasting, the food manufacturing companies she analyzed “…lost 1% in operating margin and have increased average inventories by 22% over the last decade.”
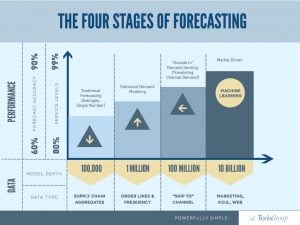
But there is a clear path to improved forecasting, through “demand modeling” – that captures the underlying causes that are driving demand. I’ve summarized this path forward in three high level steps:
Step 1: Forecast from the bottom-up – Bottom-up statistical forecasting models the unique demand signals and patterns for each individual Item-Location—customers trending up and down, regions growing or shrinking, stock keeping units (SKUs) exhibiting unusual behavior—to create a more accurate forecast and higher confidence level. The significant information about variability and volatility is in this granular detail. By analyzing demand in its true component form, not in some mushy aggregated state, it’s much easier to capture the demand signal. True demand lives at a highly granular level, so that’s the level to capture it.
Step 2: Become “Outside In” – Outside in means augmenting the more granular demand data in step 1 with downstream channel data. Sometimes called “demand sensing”, this approach translates downstream demand into a demand signal for each upstream Item-Location, (SKU/L), improving the reliability of the statistical forecast and reducing demand latency. Cecere summed up the benefit in a recent post: “… companies find that the use of downstream data pays for itself in less than six weeks, every six weeks… and transformed their supply chains 5X faster than competition.
Step 3: Become “Market-driven” – The key to a true market-driven forecast is to begin exploit the wealth of market data to understand the impact of complex demand drivers like media, promotions, and new product introductions. Then a predictive supply chain demand-analytics or machine-learning engine can translate the data into actionable information.
The ultimate goal for market-driven forecasting is to capture and model the relevant market attributes that impact the demand signal—generating more signal and less noise to anticipate true demand. There are many steps in the journey, and many places to begin. Companies that do so both prepare for the future and also drive immediate improvements in forecast accuracy, service levels, and the bottom line.
For a whitepaper on the steps up to a market-driven forecast, plus an extra embedded copy of the infographic at the top of this page, click on the button below.