Why Forecast Accuracy Alone Can’t Solve Service Level Problems
In recent blogs we’ve discussed the importance of forecast accuracy, but forecast accuracy alone can’t solve inventory issues—particularly in the long tail where a zero forecast for slow-moving items renders WMAPE forecast error essentially meaningless. The best way to understand this can be to think about the main demand drivers in both the head (fast-moving items) and tail (slow-moving goods).
In fast-moving items, four common issues erode forecast accuracy: seasonality, exceptional demand (such as promotions), product launches and over fit error. All lead to off-the-mark projections, lost sales and expediting costs.
- To forecast seasonality more accurately requires clustering products with homogenous seasonality demand behavior into families and then calculating the seasonality of each family, typically in each geographic area.
- Demand errors caused by exceptional sales from promotions—and declining sales upon its expiration—can be mitigated by making uplift calculations from the baseline, decreasing the volume as the campaign winds down.
- A good product introduction forecast usually requires demand collaboration, consensus forecasting bringing together demand and forecast data from multiple stakeholders in the product rollout.
- A final driver is “over fit” error caused by “best fit” approaches that use a selection process that switches between competing forecasting methods based on which was most successful in recent past history. This is essentially like assuming that you will beat the stock market by continually switching between stock picking algorithms based on what was most successful last week. Instead a self-adaptive forecasting algorithm is needed, but that’s a discussion for a future blog.
For slow moving items in the long tail, however, the key to meeting demand is to ensure service levels—and this comes more from the right inventory than from the right demand forecast.
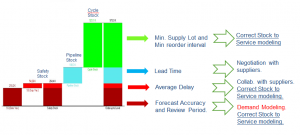
The three common types of inventory (as shown above) are safety stock, pipeline stock and cycle stock. And the variables that affect each stock type are forecast accuracy and review period, average delays (both impact safety stock), lead times (for pipeline stock), and minimum supply lot and minimum reorder interval (for cycle stock).
The key point here is that improving forecast accuracy only improves safety stock calculations related to demand variability, which represents only a portion of the total stock calculation
Safety stock calculations can also be improved via better demand modeling which is accomplished via precise and robust statistical model of demand variability. While it’s helpful to forecast average demand, the more important question is the upper demand boundary and the likelihood of the various possible outcomes in between. In other words, knowing the probability of demand being 1 unit or 10 units or some number in between is far more important than the actual forecast, which will likely be close to zero. This is commonly known as stochastic modeling.
Another opportunity for improvement is supplier lead time and average delay, which can often best be addressed via negotiation and supplier collaboration.

Focusing on forecast accuracy is crucial for fast-moving items. But for the long tail, it’s more important to concentrate on stock-to-service modeling to determine how much stock you need, the mix, and where and when you need the inventory to achieve service level targets.
Click below to read about how a famous sports car company overcame their service level problem.


