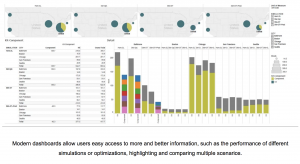
Changing Supply Chain Planning Dashboards

Think about how the automobile dashboard has changed in the last 20 years. It wasn’t that long ago that it displayed simple information—how fast the vehicle was going (speedometer), how rapidly the engine was turning (tachometer), how far the car had been driven (odometer), and a clock that told time. There were a few warning lights—oil or fuel low, engine hot. Today, car dashboards have navigation, Bluetooth music and phone connections, back-up cameras, and lots of sophisticated maintenance indicators.
The face of the supply chain planning dashboard is changing just as dramatically. In the past, supply chain decisions were mostly reactive, relying on static information and a limited understanding of supply chain conditions. Supply chain planners have always wanted more information and more analysis. Now they’re getting them—as analytic engines decode large amounts of near real-time demand data flowing continuously from the point of sale and channels, and from supply tiers like transport, warehousing, and manufacturing.
With the growth of data—and the complexity of decisions in extended supply chains—companies no longer rely exclusively on manual analysis in decision making. They require analytics–and supply chain planning dashboards need to provide the data they need at a glance.
Gartner defines supply chain analytics as “techniques and technologies that incorporate advanced modeling with data management to uncover existing relationships among variables to determine the probability of a future outcome that can drive a business decision.” (Optimizing Business Performance with Supply Chain Analytics, Noha Tohamy, January 2013).
Lora Cecere, in her report Big Data and Analytics (February 2015) describes four kinds of analytics most useful to supply chain planners: Descriptive, Predictive, Prescriptive, and Cognitive.
Descriptive analytics describes what happened. Largely reporting, it helps supply chain planners stay in touch with reality through a single source of the truth. It deploys techniques such as clustering, association, pattern-based analysis, visualization, classification, and reporting.
Predictive analytics extracts information from data to predict trends and behavior patterns. Its tools are simulation, what-if analysis, scenario management, and statistical and causal forecasting. The focus is on what will happen, so supply chain planners can better understand the most likely future scenario and its business implications.
Prescriptive analytics builds upon predictive analytics, suggesting the best course of action based on expected future scenarios. The emphasis is on what the supply chain planner should do based on the information. It’s a formula for collaboration to maximize business value, informed by advanced analytics. It relies on deterministic and stochastic optimization and rapid re-planning.
Cognitive analytics is built around cognitive learning—using a rules-based engine to learn and adapt. It is the next step toward intelligent response, deploying highly automated optimization solutions that get smarter over time.
Automobile dashboards have changed. So have supply chain planning dashboards, taking advantage of new forms of analytics. Are you still driving your supply chain with an old style dashboard? If so, there may be time to take advantage of the changing face of supply chain dashboards.


