Advanced Supply Chain Planning with Probabilistic Forecasting
In the fast-paced world of modern supply chains, traditional forecasting methods fall short. Advanced supply chain planning is being transformed by probabilistic forecasting, which revolutionizes demand forecasting, supply planning, and inventory optimization. This approach significantly improves forecast accuracy and enhances decision-making across distribution networks.
Enhancing Inventory with Probabilistic Forecasting
A supply chain is a complex ecosystem influenced by dynamic variables. Traditional supply chain planning tools rely on deterministic forecasting, generating single-point estimates that often misrepresent real-world complexities. These outdated methods lead to chronic inventory imbalances—excess stock in some locations and stockouts in others.
Probabilistic forecasting changes the game by producing a range of possible outcomes with associated probabilities. Advanced supply chain planning software leverages these probability distributions to optimize inventory targets, balancing service levels against carrying costs with mathematical precision.
The Science of Demand Planning: Improving Forecast Accuracy
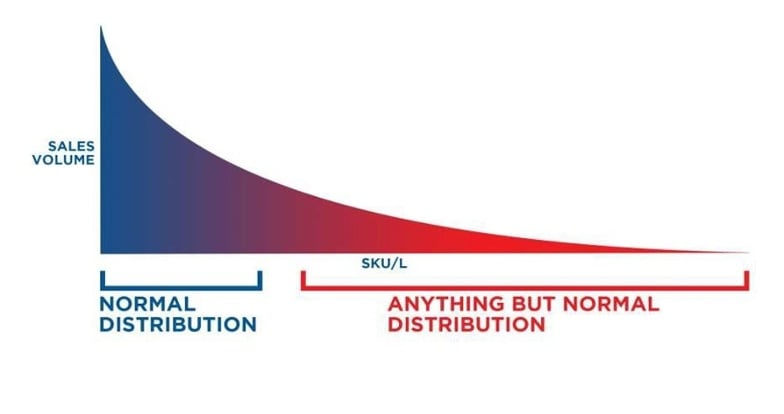
Consider this example: A traditional forecasting system analyzing tire sales might observe 12 units sold annually and determine an average monthly demand of one tire. However, this approach ignores real purchasing behavior, such as customers buying complete sets of four tires.
Probabilistic demand forecasting, in contrast, provides a full probability distribution, revealing actual purchasing patterns and enabling inventory planners to align stock levels with demand realities. This approach is particularly effective in multi-echelon supply chains where thousands of SKUs must be managed with high accuracy.
Real-World Success: Demand Planning & Supply Planning Results
Industry research supports the effectiveness of probabilistic forecasting. Nucleus Research classifies inventory optimization as a predictive analytics function, with stochastic (probabilistic) planning systems consistently outperforming traditional methods in optimizing stock levels.
Probabilistic Forecasting Benefits in Supply Planning:
- Slow-moving inventory management
- Products with intermittent demand
- Spare parts and specialty items
- New product introductions
- Seasonal merchandise with variable demand curves
For products with irregular demand patterns, traditional forecasting methods fail. Probabilistic demand planning enables businesses to optimize stock levels while reducing costs and improving service levels.
Case Studies: Achieving Advanced Supply Chain Planning
Shamir Optical Industry
Shamir Optical, a global leader in prescription lens manufacturing, implemented probabilistic forecasting to enhance service levels while reducing inventory investment. By setting customized service levels for each SKU-location combination, their supply chain planning software reduced inventory costs by 25% while improving service levels to over 99%.
Polaris Industries
Polaris Industries, a powersports manufacturer, integrated probabilistic demand planning into its supply chain strategy. The result? A 15% reduction in inventory costs and a 10% improvement in customer service levels, optimizing supply planning for competitive advantage.
Competitive Advantages of Probabilistic Supply Chain Planning
Probabilistic forecasting delivers measurable benefits in supply chain management:
- Enhanced Forecast Accuracy: Models multiple potential demand outcomes rather than a single estimate.
- Optimized Safety Stock: Calibrates inventory to actual demand variability.
- Improved Service Levels: Reduces stockouts and ensures inventory availability.
- Lower Inventory Costs: Eliminates excess buffer stock while maintaining service targets.
- Smarter Allocation Decisions: Aligns stock distribution with actual demand trends.
- Advanced Supply Planning: Improves procurement and production scheduling decisions.
For supply chain leaders, embracing probabilistic demand planning is no longer optional—it’s a necessity for staying competitive in today’s volatile business environment.
The Future of Advanced Supply Chain Planning: AI-Powered Probabilistic Forecasting
Artificial intelligence (AI) and machine learning (ML) are taking probabilistic forecasting to the next level, enhancing supply chain planning with greater predictive capabilities.
Cutting-Edge AI Features in Supply Chain Planning Software:
- Real-time Forecast Adjustments: AI recalibrates forecasts instantly based on market fluctuations.
- Incorporation of External Data: Uses social media sentiment, weather patterns, and economic indicators for more precise demand forecasting.
- Early Demand Pattern Detection: Identifies trends before they emerge in historical data.
- Scenario Simulation: Runs thousands of supply chain scenarios to determine optimal inventory placement.
Digital Twins: The Next Step in Supply Planning
Advanced supply chain planning platforms now offer digital twin simulations—virtual replicas of entire supply networks. Digital twins enable businesses to:
- Test inventory strategies in a risk-free virtual environment
- Visualize demand fluctuations and supply chain ripple effects
- Identify vulnerabilities before they disrupt operations
- Optimize inventory levels with greater precision
According to Gartner, demand forecasting is one of the most widely used AI applications in supply chain planning. Companies leveraging AI-powered probabilistic forecasting gain a competitive advantage by improving forecast accuracy, supply planning, and operational agility.
Conclusion: Why Probabilistic Forecasting is Essential for Supply Chain Success
For businesses aiming to optimize supply chain performance, probabilistic forecasting represents a transformative approach to demand planning and inventory optimization. By improving forecast accuracy and leveraging AI-enhanced analytics, organizations can reduce costs, increase service levels, and navigate supply chain volatility with confidence.
The future of supply chain planning is here—powered by probabilistic forecasting, AI, and digital twin technology. Forward-thinking companies that embrace these innovations will gain lasting competitive advantages in supply planning and demand forecasting.