
Since the beginning of time – OK, since the beginning of demand forecasting — the standard approach has been a single number forecast that works relatively well with stable high volume demand. Traditional forecasting tools such as SAP APO, designed 25 years ago or more, generally hold their own in this environment.
But conditions have developed and grown over the years into areas where traditional signal number forecasting struggles to offer satisfactory results, and a new probabilistic forecasting paradigm has become the best approach. They include:
 Probabilistic forecasting understands there is inherent uncertainty in future demand, whether the SKU is a fast or slow mover. Its outcome—a range of values, each with a probability of happening—mirrors demand in the real world. Variability is part of the calculation, and the granularity of the baseline demand is as detailed as possible—by individual sales order line, daily by item and ship-to location.
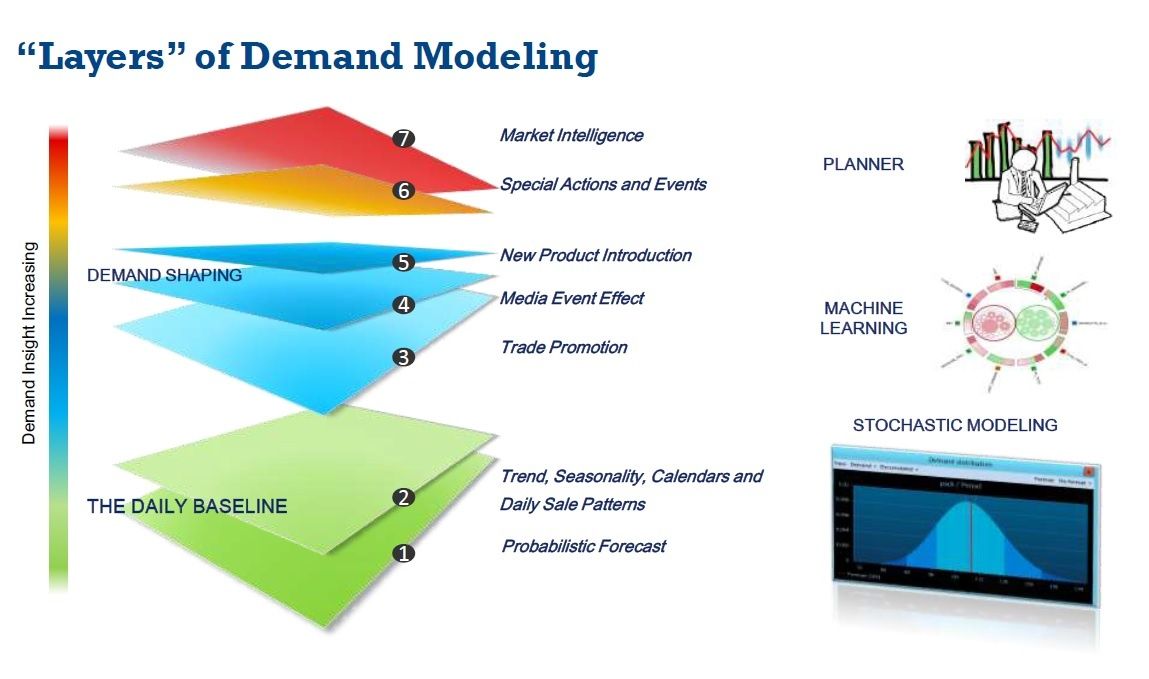
Because probabilistic forecasting focuses on underlying demand patterns and causes, new influences or early signals that shape the forecast can also be added to the demand model – such as social media effects, trade promotions, and product life cycle profiles. Machine learning can refine the forecast by crunching external data.
Probabilistic forecasting understands there is inherent uncertainty in future demand, whether the SKU is a fast or slow mover. Its outcome—a range of values, each with a probability of happening—mirrors demand in the real world. Variability is part of the calculation, and the granularity of the baseline demand is as detailed as possible—by individual sales order line, daily by item and ship-to location.
Because probabilistic forecasting focuses on underlying demand patterns and causes, new influences or early signals that shape the forecast can also be added to the demand model – such as social media effects, trade promotions, and product life cycle profiles. Machine learning can refine the forecast by crunching external data.
- Aftermarket demand, spare or service parts, or MRO
- Long tail, intermittent or lumpy demand, caused by revenue slicing from large product portfolios, shorter replenishment cycles or shorter product lifecycles
- More channels to market, with aggregated demand coming from multiple “demand streams”
- Online retailing, which typically deals with large product portfolios and less unpredictable demand
Under the Hood
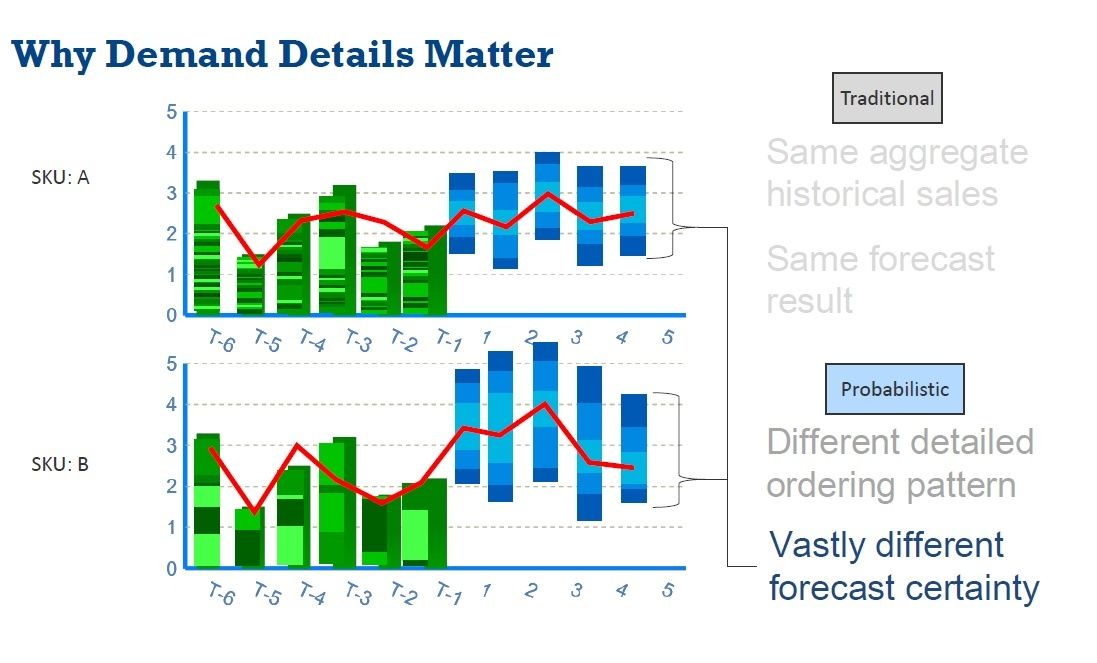
An underlying problem with the traditional, top-down approach is that it smooths out variability from individual demand streams by aggregating demand. That makes it easier to generate a high-level forecast—but item-location level forecast quality is poor because specific demand signals are missed. For instance, two products with the same aggregated historical sales get the same forecast, even though a look at the details reveals widely different order patterns and therefore the need for different amounts of inventory to handle those different demands.When using the older top-down approach, a high-level forecast is made and then rather arbitrarily allocated down to an item-location level for inventory and replenishment—the level at which business decisions are taken. So crucial, granular information about volatility and error at that level is lost.
Probabilistic forecasting understands there is inherent uncertainty in future demand, whether the SKU is a fast or slow mover. Its outcome—a range of values, each with a probability of happening—mirrors demand in the real world. Variability is part of the calculation, and the granularity of the baseline demand is as detailed as possible—by individual sales order line, daily by item and ship-to location.
Because probabilistic forecasting focuses on underlying demand patterns and causes, new influences or early signals that shape the forecast can also be added to the demand model – such as social media effects, trade promotions, and product life cycle profiles. Machine learning can refine the forecast by crunching external data.
Making the Switch
One company who adapted probabilistic forecasting to their SAP APO is Systagenix. The company—part of global wound care company Acelity—combines both fast-moving and long-tail products with continuous new product introductions and global growth, constantly changing the dynamics and demand flows of its supply chain network. Systagenix was using SAP APO for demand management with limited success. It didn’t have a structured way to capture market intelligence from its global sales organizations and distributors, and the planning team was always trying to second-guess other stakeholders and come up with a single forecast number. The company was struggling to meet the very high (approximately 98%) service levels its customers’ demanded. A new, probabilistic approach pulls historical demand data weekly from SAP into a demand forecast that evaluates statistical variability for all SKUs. Demand planning gets additional inputs from sales and finance to generate a consensus forecast. This plan is used to create an optimized inventory profile, setting dynamic safety stock and target stock levels for each SKU at each DC according to the service level required. The data is then pushed back to SAP for DC replenishment and to inform production. Systagenix squeezed service levels even further up to 99% yet significantly reduced inventory. It also dramatically improved the productivity of its planning team—from 2-3 people toiling for a total of at least 100 hours a week to produce the initial forecast, to one planner completing the task in a single day.