Get Started Using Machine Learning for New Product Forecasting
New product introductions (NPI) are critical to any company’s success, but many of them never become household names.
In fact, it’s estimated that up to 80 percent of new product launches in the consumer packaged goods (CPG) industry fail.
Adding to this already uphill battle, we don’t have trustworthy new product forecasting methods because forecasting new products with no sales data is very hit-and-miss.
Machine learning (ML) provides an effective weapon for your new product forecasting arsenal. In this blog we will share machine learning techniques that can produce fully-automated forecasts for new products.
Why Is New Product Forecasting Important?
New product forecasting is more critical than ever but also much more complex due to factors such as intermittent demand, shortened product life cycles, and increasing market volatility.
In many industries new products are a considerable part of revenue, and getting the forecast wrong results in overstocks or empty shelves and lost sales.
Traditional forecasting techniques rely on aggregated sales estimates, substitution mechanisms, and ratio mechanisms.
These dated approaches are problematic because they rely heavily on a few people with inside knowledge, they are manual and time-consuming, and they don’t scale.
Cosmetic Leader KIKO Tackles New Product Introduction with Machine Learning
Points to Remember About Forecasting Using Machine Learning
Before you dive into your machine learning project, it’s important to understand what to expect–and what not to expect.
It’s not uncommon for us to see planning teams come to us because their executive leadership has issued an edict to implement machine learning–without fully understanding this powerful technology.
When this happens, usually machine learning is thought to be a magic box that can solve all your problems without having to do anything.
The truth is, it requires effort to set up.
It is a trade-off between interpretability and accuracy in the sense that machine learning can be more accurate than a simple statistical method, but it’s usually more difficult to understand what the machine is doing.
The magic of machine learning is the fact that it is able to sort through the space of infinite possible solutions in an optimal way and find a solution which does not overthink the data too much, and that’s okay.
What to expect from machine learning:
- An automated process that helps to deal with the increased complexity.
- An additional tool to help the planners to challenge business estimates coming from other departments
- That the quality (and quantity) of input data is correlated with the quality of results
- Overall reasonably accurate forecasts
What NOT to expect from machine learning:
- No effort required to set up (careful data sourcing and data preparation is fundamental)
- A magic box that we can trust to do our job
- Both interpretability and accuracy of results (there usually is a tradeoff)
- To extrapolate from the past using information we have not given
New Product Forecasting Requirements
In order to be successful forecasting new product launches, you need visibility along
three dimensions:
- Product: usually the SKU, possibly a reduced scope
- Market: sometimes global, but preferred to have visibility at warehouse/location level (or more)
- Time: usually a weekly or monthly time bucket with a forecast horizon of a few weeks/months
Once you have these three requirements it’s time to break down the complete forecast for your early-stage product.
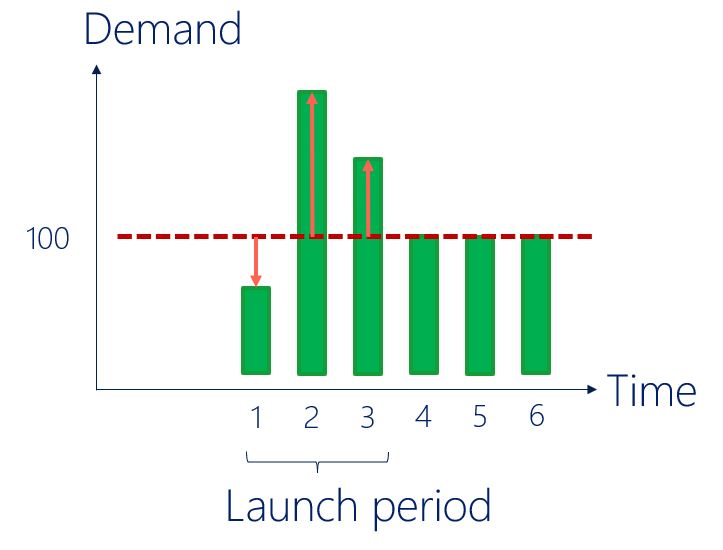
New product introduction is basically Initialization plus Launch Profiles.
- Initialization: what will the average demand be after the launch period? (red line in figure below). This is usually framed as a regression problem.
- Launch Profiles: how will the demand vary with respect to the average over the launch period? Launch profiles explore the market potential for your new product (orange arrows in figure below). While this can be framed in many ways, at ToolsGroup we found a useful approach is clustering the profiles in the past and using classification for scoring in the future.

Then, it all comes down to preparing a big spreadsheet!
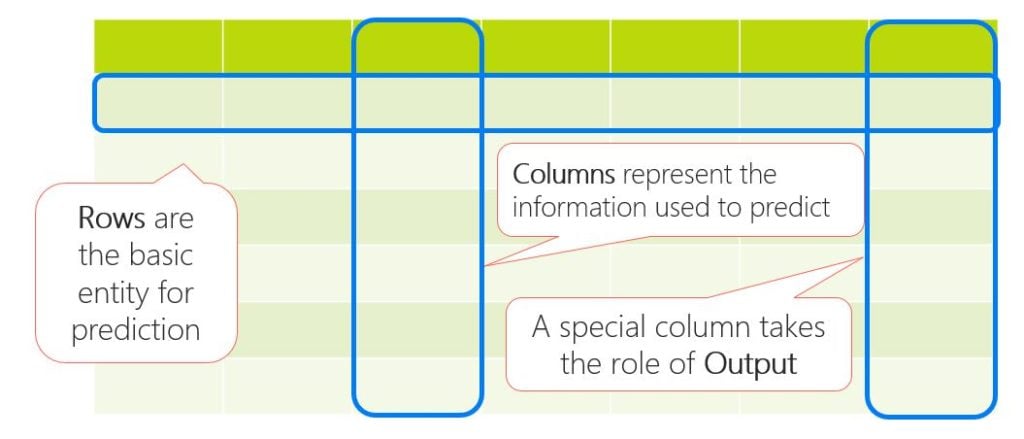
Some people are surprised to learn that, most of the time, for a common machine learning task like regression or clustering, all the system needs to run is a table.
The number of rows I will have in my table will be the number of launches that I had in the past which I will use to train the agent, and rows next year, for which the agent will do the prediction.
The columns are the attributes or information that the machine learning algorithm will use to train in the past and then to perform the condition in the future.
A critical column in this table is for the output, which I know for past launches and will predict for future launches (the output column would not be present in the case of clustering).
For an NPI problem, the columns vary based on type of business, but in general a new product forecasting initiative should have at least one column for a price or cost.
One or more could relate to the product hierarchy, as well as the market hierarchy–if you will be introducing the product in numerous markets.
You will also want to allow the algorithm to separate and learn a little bit about the different launch periods, such as summer and winter.

A Real World Example of New Product Introduction
Company A is an eyewear manufacturer.
Eyewear is a highly seasonal product, and every year this particular company launches many new models. 60% of Company A’s products are seasonal (lifecycle duration around 12 months). Every year the new models are launched in a different period in the year.
Forecasts for new products must be available six months before the launch, when they start production of the new eyewear.
Therefore, new product forecasting is crucial for the business.
This was an ideal case for applying machine learning techniques for a seasonal forecast using ToolsGroup Service Optimizer 99+ (SO99+).
Demand was modeled including calendar effects and seasonality.
ToolsGroup’s machine learning engine was used for both the Initialization problem (using a ML regression algorithm) and for the Launch Profiles problem (clustering profiles in the past and classifying them in the future).
All the different components are then put together to generate the overall forecast.

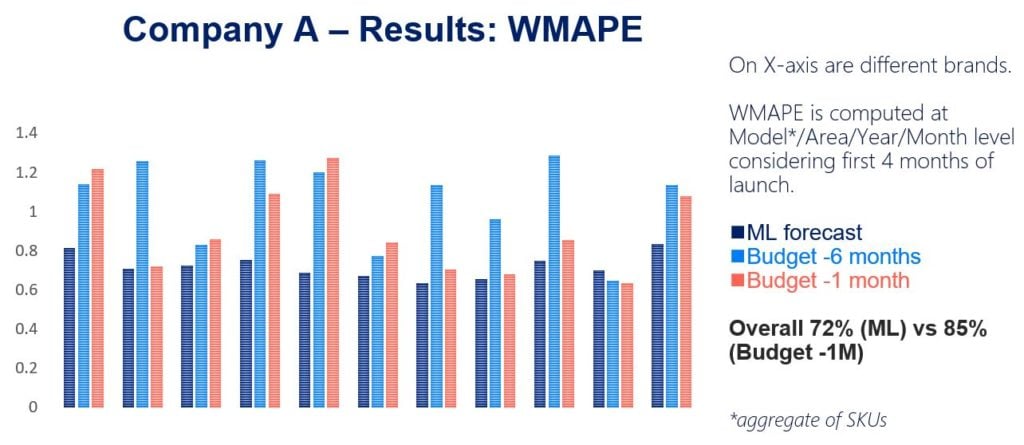
We compared our machine learning forecast with the forecast Company A generated six months before (light blue) and one month before (red).
On the X axis we see different brands, all anonymized, and we see that our dark blue bar (ML result) is generally lower, meaning the forecast error is lower and the forecast is better than the red line.
Overall, using machine learning the forecast accuracy increased by 13 percentage points over the standard forecast done one month before.
If you take the time to plan your project well and apply the technology correctly, machine learning can be an invaluable tool to solve business problems and deliver real value.
Pietro Peterlongo is Principal Data Scientist at ToolsGroup, where he develops statistical and machine learning models for demand forecasting to be used in ToolsGroup supply chain planning software.


