Optimizing Inventory Is About Improving Service While Lowering Inventory. Wait, What?
Optimize
/ˈɒptɪmʌɪz/
verb
1. make the best or most effective use of (a situation or resource).
(Oxford Languages)
One of the hardest parts of my job is helping customers get to grips with complex, counterintuitive supply chain concepts. Take the “bullwhip effect”: a key principle that’s so counterintuitive a “Beer Game” simulation was invented to prove to doubters the extent to which even minor fluctuations in demand can cause chaos upstream.
Equally mystifying to people is the concept of inventory optimization. I explain to people that if they’re getting this process right, overall service levels should go up by 3-5% as overall inventory levels decrease by 15-30%.
“Wait, what? – Don’t you have to raise inventory levels to guarantee service levels?” is typical of the reaction I get.
Before I answer that, let me rewind to my last post, “Service Level Should Be Your Number One Supply Chain KPI…But What Does It Really Mean?” I distinguished between being able to serve aggregate demand and being able to fulfill customer orders. The former might look good on executive dashboards, but it’s the latter that’s key to providing great customer experiences and loyalty.
I can’t emphasize strongly enough how important it is now, as we work through crisis times, to set inventory policies that ensure order line fill rates (OLFR) are met. According to McKinsey’s report Adapting customer experience in the time of coronavirus, during the last recession those companies that provided the highest customer experiences delivered three times higher returns to shareholders than their laggard peers.
Now let’s dig deep into how you can achieve high OLFR, efficiently, to meet business objectives for freeing up working capital, cutting waste and holding costs, and hitting profitability goals. Spoiler alert: it’s all about getting the stock mix right across your SKU portfolio. And this is one of those rare situations where having a lot of SKUs can be your friend – as I’ll explain later.
Time to put the ABC segmentation sacred cow out to pasture
If you’re still using ABC inventory segmentation and struggling with excess inventory levels, it’s time for a new approach. I urge you to read one of our most popular blogs “What’s wrong with ABC inventory classification” for a detailed explanation of why this process, conceived in the 1960s, has had its day. In a nutshell, ABC is too blunt a planning instrument for today’s distribution complexity, and the volume and variety of most companies’ SKU portfolios. Planners using ABC end up applying the same inventory policies to too many diverse items and end up with unacceptable surpluses and shortages. ABC was okay for managing inventory, but not optimizing it. Time to put that sacred cow out to pasture.
A better way: Inventory mix optimization
Unlike ABC, which involves segmenting SKUs into three broad categories by ‘business value’, assigning a blanket inventory policy for each SKU in a single bucket. inventory mix optimization segments items by ‘service class’, then assigns each individual SKU a unique service level and inventory policy. These more customer-focused categories should be relevant to sales and marketing like ‘accessories’, ‘high-margin items’, ‘own-brands’, ‘high-end brands’ and ‘critical spare parts’. You still define aggregated service level goals, but by service class instead of ABC class.
With inventory mix optimization, you use advanced planning software to apply ‘stock-to-service’ curves to optimize service levels and safety stock levels for each SKU-Location. The stock-to-service curve shows the relationship between the desired service level (order line fill-rate) and the average stock on hand required, while providing the necessary control levels (safety stock, reorder level etc.)
“What’s wrong with ABC inventory classification” covers the mechanics of this in detail so I won’t belabour it here. However, remember when I said having lots of SKUs can be your friend? A basic tenet of inventory mix optimization is assigning lower service levels to certain service classes – such as items in the long-tail that customers don’t need urgently and sell infrequently. Effectively these items “subsidize” higher service levels for classes of popular, critical items.
Inventory mix optimization in practice: Lubinski
Theory is all well and good, but let’s see how inventory mix optimization plays out in the real world.
Lubinski, the sole importer for Citroen and Peugeot vehicles in Israel moved to an advanced, intelligent planning system to optimize its inventory of roughly 20,000 parts, of which 75 percent were slow-movers. This established, family run business was initially resistant to doing so because it was running profitably with ABC inventory planning in place. But it had a hunch that outcomes could be significantly improved.
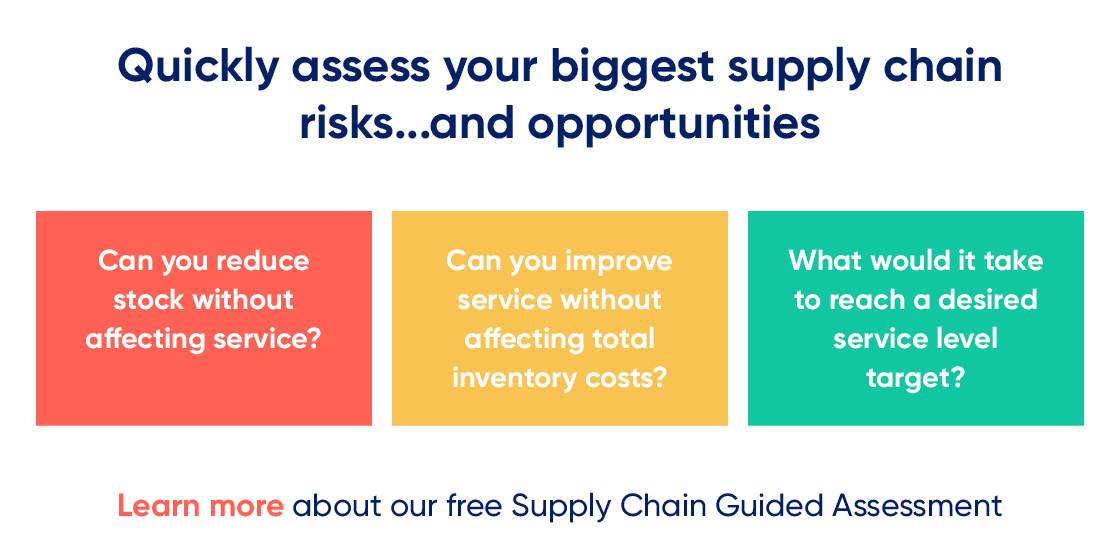
To test the concept of moving from ABC and spreadsheets to a new system based on inventory mix optimization, Lubinksi ran a side-by-side comparison–what we offer in a ‘Guided Supply Chain Assessment’.
The results were conclusive. Lubinkski achieved a 25 percent reduction in inventory costs, slashed rush orders by air by a third, and saved considerably on waste and obsolescence. All of this is happening while maintaining well above average aggregate service levels of 95-96 percent – with individual service levels tuned to the needs of each product. The company returned an extra €1.5 million cash to the company’s bottom line, solely from inventory savings.
Planner productivity increased as well. Lubinski’s new system is almost completely ‘self-driving’. Today one person spends part of a single weekday managing the process and the planning team is now free to engage in more valuable, customer-facing work.
The only regret from Lubinksi’s spare parts planner on the eve of his retirement was “I really wish we had done this sooner!”
The difference with our ‘game’ is that outcomes are real
Lubinski’s story is compelling but not unique. Hundreds of our customers that have made the move to service-driven planning experience similar outcomes.
I hope my two posts on this topic have given you some inspiration to try out this new approach to inventory optimization for yourself. Just like supply chain students’ response to the Beer Game and the bullwhip effect, Lubinksi’s planners had to see in order to believe that a counterintuitive supply chain principle really lived up to its promise. The difference is that our guided assessments use real data, so you can start gaining real business benefits while improving customer service levels. And during these crisis times, that’s never been more important.